
How to Build a Career in Data Analytics Without a Computer Science Degree
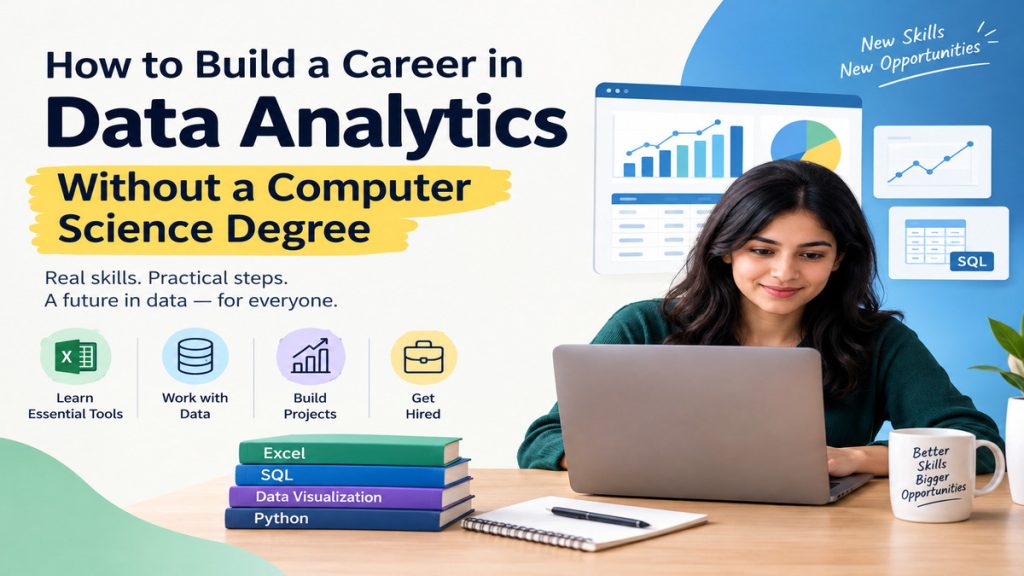
All businesses are gathering information on customers, products, employees, and expenditures, and someone must make decisions based on the data. That individual is the data analyst. Unlike many career changers imagine, the job is open to a broader cross-section of the population than a typical career change. A lot of working analysts trained in commerce, economics, biology, literature or engineering, and some even began their careers with no relation whatsoever to technology.
This article outlines how to find a job, how to gain the skills, how to prove it without a technical degree, the order you should acquire them and much more. It’s for graduates from all streams, career changers and career re-entry individuals.
What a Data Analyst Actually Does
A data analyst answers questions with evidence. A retail manager wants to know why sales fell in one city. A hospital wants to know which departments have the longest waiting times. A marketing team wants to know which campaign brought customers who stayed. The analyst finds the relevant data, checks that it is reliable, studies it, and explains the answer in a form that helps someone decide what to do.
Most of the time goes into four activities:
- Getting and cleaning data. Records come from databases, spreadsheets and software exports. They often contain duplicates, missing values and inconsistent labels, so a large share of the work is making the data usable.
- Analysing it. This means grouping, comparing, calculating rates and trends, and testing whether a pattern is real or just chance.
- Reporting. Analysts build dashboards and regular reports so that colleagues can follow the numbers without asking for them each time.
- Communicating. The most valuable step is explaining what the numbers mean and what action they suggest, in plain language, to people who are not specialists.
- This is different from data engineering, which builds the systems that move and store data, and from data science, which often involves predictive models and heavier mathematics. Analytics is the most accessible entry point, and it can lead to either of those paths later.
Why a Computer Science Degree Is Not Required
Job listings often mention a degree in computer science, statistics or a related subject. In practice, the daily work of an entry-level analyst depends on a short list of skills: spreadsheets, SQL, basic statistics, a visualization tool and clear communication. A computer science course teaches many things an analyst rarely uses, such as operating systems, compilers and large-scale software design. The skills that matter can be learned in months, and they can be demonstrated directly through projects.
Employers also know that domain understanding is hard to teach. A former accountant understands how a business reads its financial statements. A former nurse understands how patient flow works. A former teacher understands how exam results are used. These people ask better questions and notice when a number looks wrong, which is why their background can be an advantage over a purely technical one.
That said, the lack of a degree is not irrelevant. Some employers screen for it, and some roles, especially in large technology companies or in machine learning, lean heavily on formal training. Plan for this by building visible proof of skill, using referrals where you can, and targeting roles where practical ability decides the outcome.
Common Myths
Several beliefs stop capable people from trying. The first is that you must be excellent at advanced mathematics. In reality, arithmetic, percentages, averages and basic statistics cover most analyst work. The second is that you must be an expert programmer. SQL is essential and Python or R is useful, but many tasks use only spreadsheets and BI tools. The third is that certificates are what employers want. They help with structure, but projects and interview performance carry more weight. A fourth is that you must learn every tool, when one database language, one BI tool and one analysis language are enough to begin. Finally, many people assume their earlier career does not count, yet industry knowledge is often the deciding factor between two candidates.
The Skills You Need, in the Order to Learn Them
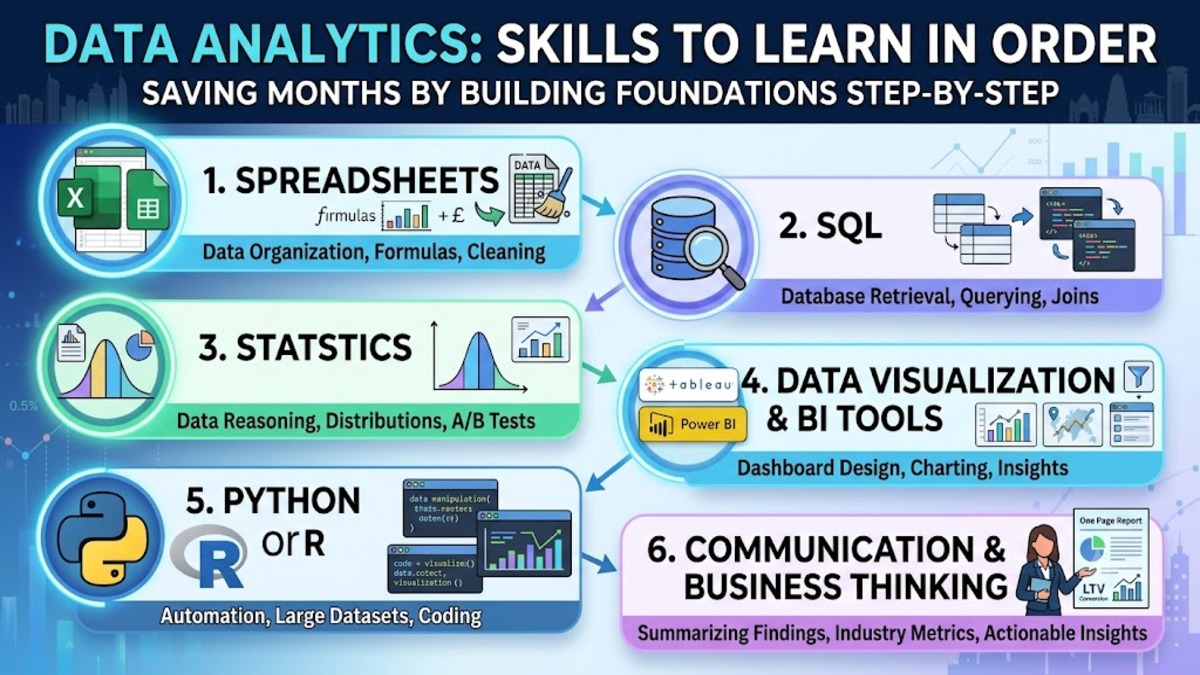
Learning in the right order saves months. Each skill below builds on the one before it.
1. Spreadsheets
Excel and Google Sheets teach how data is laid out in rows and columns and how to ask simple questions of it. Aim to be comfortable with lookup functions such as XLOOKUP or VLOOKUP, pivot tables, conditional formulas, text and date functions, and charts. Practise on messy files, since cleaning is part of every real project. Spreadsheets remain the most widely used analysis tool in many organisations, so interviewers still test them.
2. SQL
SQL is the language used to retrieve and summarise data from databases, and it is the single most requested technical skill for entry-level analysts. Learn how to select and filter rows, join tables, group and aggregate, use subqueries and common table expressions, and apply window functions for ranking and running totals. A typical interview question asks you to find the top customers by spend in each month, which combines grouping with a ranking function.
3. Statistics
You do not need to prove theorems, but you must reason correctly about data. Understand the difference between mean and median, how spread and distribution affect conclusions, why sample size matters, what correlation does and does not show, and how a simple A/B test is judged. This knowledge protects you from presenting a confident but wrong conclusion.
4. Data Visualization and BI Tools
Power BI and Tableau are the most common dashboard tools, and Looker Studio is a free option. Learn one thoroughly. Good dashboards answer a specific question, use appropriate chart types, avoid clutter, and let the reader filter without breaking the story. Learn also how to design a chart for someone who has thirty seconds to read it.
5. Python or R
Once the foundations are in place, learn to load files, clean data, summarise it and plot it using pandas and matplotlib in Python, or the tidyverse in R. Code lets you handle larger files, repeat work automatically and document your steps. Python is more frequently requested in job listings and is the better choice if you may later move toward engineering or machine learning.
6. Communication and Business Thinking
This is the skill that separates a useful analyst from a technician. Practise writing a one-page summary that states the question, the finding, the evidence and the recommended action. Learn the metrics of your target industry, such as conversion rate and customer lifetime value in e-commerce, or bed occupancy in healthcare.
Roles to Target
| Role | Main Focus | Good Starting Point For |
| Data Analyst | Queries, reports, and dashboards | Most career changers |
| Business Analyst | Business requirements and insights | Operations and management backgrounds |
| MIS / Reporting Analyst | Regular reports and dashboards | Finance, accounting, and administration |
| Marketing Analyst | Campaign and customer analysis | Marketing and sales backgrounds |
| Operations / Supply Chain Analyst | Costs, delivery, and inventory | Logistics and manufacturing |
| Healthcare or Education Analyst | Outcomes and performance data | Clinical, teaching, and public sector backgrounds |
A Realistic Learning Plan
| Period | Focus | What to Finish |
| Month 1 | Spreadsheets and Data Thinking | Clean a messy dataset and build a pivot summary. |
| Month 2 | SQL Fundamentals | Complete 40–60 practice queries covering joins, grouping, and window functions. |
| Month 3 | Statistics and a BI Tool | Build a dashboard using a public dataset and explain the findings in writing. |
| Month 4 | Python or R Basics | Repeat an earlier data analysis using code. |
| Month 5 | Portfolio Projects | Publish two to three complete projects. |
| Month 6 | Job Search | Prepare a resume, update LinkedIn, practise mock interviews, and apply for jobs regularly. |
Short daily sessions work better than long weekend ones, because skills like SQL are built through repetition. Whatever you study, apply it on data you care about. Sports statistics, household spending, local election results and public transport data all make good practice material and keep you motivated.
Preparation for a Data Analytics Career and Get Your First Job
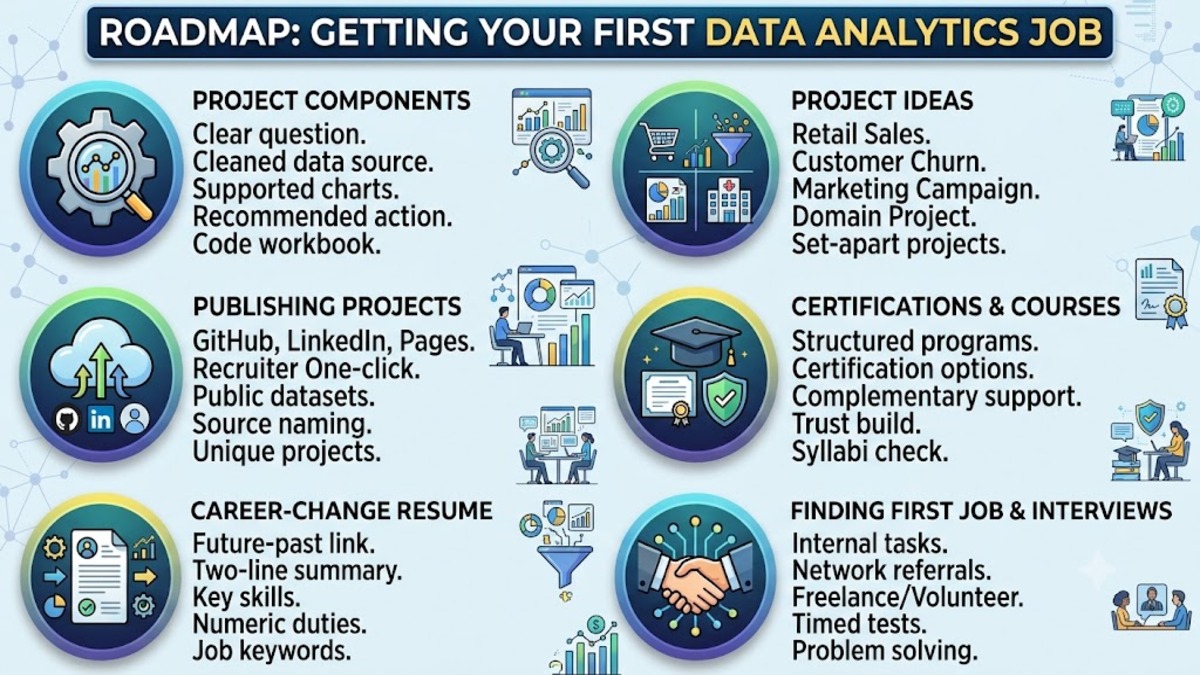
This guide outlines a step-by-step roadmap to launch a data analytics career, covering essential skills like SQL, Excel, and visualization tools. It provides actionable strategies for building a strong portfolio and navigating the job application process to land your first role.
What Each Project Should Contain
- A clear question that a decision-maker would care about.
- A named data source and a note on how you cleaned it.
- Analysis supported by a few well-chosen charts.
- A findings section that states the answer and a recommended action.
- The workbook, queries or code, so that a reviewer can check your method.
Project Ideas
- Retail or e-commerce sales analysis using SQL and a dashboard, showing which products, regions and months drive revenue.
- A customer churn study in Python, identifying the factors linked to customers leaving.
- Marketing campaign performance, using funnel metrics and basic testing to recommend where the next budget should go.
- A project from your old field, such as hospital waiting times or exam results, which shows domain knowledge and storytelling together.
Publish your work on GitHub, a simple personal page or LinkedIn so that a recruiter can open it in one click. Use public datasets from government open-data portals or Kaggle, and always name the source. Avoid projects that thousands of beginners have already posted, since they do little to set you apart.
Certifications and Courses
Structured programmes can help you stay consistent and give you a credential to list. Popular options include the Google Data Analytics Professional Certificate, Microsoft’s Power BI Data Analyst certification (PL-300), and vendor training from Tableau. Many universities and online platforms also offer analytics courses.
Treat certificates as support, not as the main proof. A recruiter who sees a certificate and a strong project will trust you far more than one who sees a certificate alone. Before paying for any course, check its current syllabus, fees, validity and exam rules on the provider’s own website, since these change.
Resume for Career-Change
Your resume must make the link between your past and your target role obvious.
- Begin with a two-line summary that names your target role and key tools, such as SQL, Excel, Power BI and Python.
- Place a Projects section above older jobs if your experience is unrelated.
- Rewrite past duties with numbers: reports produced, errors reduced, hours saved, revenue tracked.
- Keep it to one or two pages and use the same keywords that appear in the job listing.
- On LinkedIn, change your headline to the role you want, list your tools, and post a short write-up of each project. Recruiters search by skill and read recent posts, so regular activity improves your visibility.
Finding Your First Job
Start where you already have credibility. If you work in a company, look for data tasks in your current job, such as the monthly report nobody enjoys, and improve them with better tools. That becomes both a project and an internal case for a move. If you are changing companies, apply first to employers in your previous industry, where your domain knowledge counts.
Search for several titles, including junior data analyst, business analyst, MIS executive, reporting analyst and operations analyst. Tell friends, former colleagues and mentors that you are looking, because referrals often bypass degree filters. Message working analysts to ask how they started. Most people will share advice, and conversations sometimes lead to openings. Apply steadily, five to ten tailored applications a week, rather than sending a single generic resume to hundreds of listings.
Internships, apprenticeships, freelance work for small businesses and volunteering with a non-profit’s data are all legitimate ways to gain experience. Describe them with results in the same way you would describe a job.
Preparing for Interviews
Expect five stages. A screening call covers your background, motivation and tools, so prepare a short story that links your past work to analytics. A technical test sets timed SQL or Excel questions, which is why daily timed practice with joins, grouping and pivot tables pays off. A business case asks something like “Orders fell 8% last week. What do you check?”, and the best structure is to define the metric, segment the data, compare periods, form hypotheses and propose a next step. A project review asks you to walk through one project, so be ready to justify each choice and say what you would change. A behavioural round explores how you handle messy data and difficult stakeholders, so keep two or three real stories with outcomes.
When answering a case question, say what you would measure, where the data would come from, how you would analyse it, what you expect to find, and what action you would recommend. Interviewers care more about structured thinking than about a perfect answer.
Common Mistakes to Avoid
- Watching tutorials without building anything. Progress comes from finished projects, not hours of video.
- Switching tools constantly. Master one BI tool and one programming language before adding more.
- Skipping statistics. Charts built on poor reasoning mislead the people who rely on them.
- Ignoring your previous field. It is your strongest differentiator.
- Presenting dashboards with no message. Always say what the reader should conclude and do.
- Applying only to the title “data analyst”. Related titles often involve the same work.
- Waiting until you feel ready. Apply once you have SQL confidence and two solid projects, and keep improving while you search.
Frequently Asked Questions
1. Can I become a data analyst with a non-technical degree?
Yes. Many analysts hold degrees in commerce, arts and science. Employers mainly look for SQL, spreadsheet and visualization skills and for evidence that you can analyse data and explain the result.
2. How long does it take to get a first job?
Part-time learners often take between six and twelve months, though this depends on your starting point, the time you invest and the hiring market. Treat any fixed timeline as a rough guide.
3. Do I need advanced mathematics?
No. Basic statistics and comfortable arithmetic cover most analyst work. Advanced mathematics matters mainly for machine learning roles.
4. Should I learn Python or R first?
Learn SQL first. After that, Python is the safer choice because it appears in more job listings.
5. Is a paid bootcamp necessary?
No. Free and low-cost resources are enough if you practise consistently. Bootcamps provide structure and support, so judge them by outcomes you can verify, not by promises.
6. Do I need a master’s degree?
Not for most entry-level roles. A postgraduate programme can provide structure and a network, but it is only one route.
Final Thought
A computer science degree is one way into data analytics, and it is far from the only one. The route that works for most career changers is straightforward: learn spreadsheets, SQL and a dashboard tool; add statistics and a programming language; build two or three projects on real data; publish them; and use your earlier experience to explain why you understand the problems the numbers describe. Begin this week with one dataset and one question, and let each small project build the next.
Read More: Career Change After 30: How to Transition from Non-Tech to IT or Data Science
📚 Related Articles



👉 You May Also Read
📚 Related Articles
- Business After 30 or a Stable Job: Which Path Should You Choose?
- How to Return to Work After a Career Break: Skills, Jobs and Preparation in 2026
- Best Career Options After Class 12 for Average Students in 2026
- Career Change After 30: How to Transition from Non-Tech to IT or Data Science
- Government Jobs by Age Limit: Eligibility and Opportunities in 2026
🔥 Popular Posts



📌 Explore Categories
- About India
- Artificial Intelligence & Machine Learning
- Calendar
- Career
- Counselling
- Current Affairs
- Economy
- Education
- English Grammar
- Exams
- Festival
- Health and Fitness
- Hindi Sahitya
- History
- Intelligence Agency
- International Personality
- Know India
- Knowledge
- Maths
- Maxim
- Moral Stories
- Nature
- NEWS
- Olympiad
- Others
- Personal Finance
- Personality Development
- Politics
- Scholarship
- Science and Environment
- Sports
- States of India
- Study Abroad
- Study Tips
- Technology
- The Greatest Indian
- Uncategorized